
The scale of the U.S. census is breathtaking. For 2020, the United States Census Bureau set the total national population at 331,449,281. At 4K resolution, a tv screen representing one pixel for each person would be six stories high and, at 145 feet, longer than a Boeing 737. Meanwhile, there are more than 18,000 variables collected. At 5 seconds per variable, it would take more than 25 hours straight to even read these variable names, much less consider their descriptions!
When data gets this big and complex, interactive visual analytics goes from ‘nice to have’ to ‘essential.’ While use cases and specialized tools may vary, there are at least three common characteristics to consider:
- The patterns you see in census data vary tremendously by spatial and temporal scale, and can be biased by collection methodologies. For example, important privacy protections in place within the census aggregate sensitive data at various levels. The only realistic way to understand such patterns and make effective decisions based on them is to leverage the power of your visual cortex.
- Like many other data types, census data often works best in combination with other datasets. For example, businesses need to know where and when to target potential customers given current or potential future retail locations. Government planners and NGOs want to know which special needs populations need to be considered relative to a particular program or policy decision.
- Last but perhaps most important, these data not only vary over historic time, but are critical in many kinds of future projections. Both commercial or public sector analysts need to make decisions today about infrastructure and programs lasting many years. So a telco looking to locate 5G antennas efficiently and a local government looking to site a public school both need predictive analytics based in part on census data.
Fortunately, new tools are making census analysis not only far more granular, but orders of magnitude faster as well. Advanced techniques that leverage the parallel processing capabilities of GPUs (graphics processing units) are allowing billions of data points to be interrogated in milliseconds. When applied to U.S. census information and presented in a geospatial format, business analysts and researchers of all types can see what is happening across the country at speeds and scales never before possible.
Analytics dashboards powered by these processing technologies allow analysts, data scientists and even casual users to view changes in U.S. demographics at any scale, even by neighborhood block, at the speed of their natural curiosity. The applications for these capabilities are endless.
One Person, One Dot
For the first time ever, accelerated analytics can present practical dot density maps of the entire United States. Dot density is an intuitive method for demonstrating how humans cluster together or disperse across an area. Typically, dot density maps are slow to generate; plotting hundreds of millions of points quickly is daunting, to say the least. Moreover, conventional dot density plots don’t easily reflect changes over time, much less interactive demographic targeting workflows.
Thanks to new analytics techniques, however, today’s dot density maps can plot over a billion points at one-person-to-one-dot resolution. These can be filtered interactively to focus on particular regions, time periods or demographics. They can also be animated over time to build a visual understanding of which patterns are static and which are rapidly changing.
This type of demographic geospatial analysis is transformational. Real estate developers can immediately understand the changing needs of neighborhoods. Housing advocates can remarket older neighborhoods to emerging populations, or better justify initiatives for affordable housing. Urban planners can see where former manufacturing sites have converted to multifamily housing, or where specific populations have left a particular area. Such tools also allow governments and social service organizations to evaluate—or reevaluate—the efficacy of policies based on changes in ethnic or racial percentages or special needs populations.
Deep Dives in Seconds
The U.S. Census offers data that goes far beyond location and ethnicity. The American Community Survey, a longstanding initiative of the bureau, provides yearly information about education, internet access, transportation options, housing age and construction, home values, income, language proficiency, disabilities, migration patterns and much more.
ACS data helps the U.S. government distribute $675 billion in spending each year—but for business analysts and researchers it’s a treasure trove of additional value. It can reveal how gentrification works, or where local construction is changing demographics. It can determine how to best serve a community with retail, schools, daycare, healthcare and other community services.
Consumer goods manufacturers can use ACS information to anticipate, on a block-by-block basis, which streets will be most likely to need new appliances, roofing materials or power saws. Accelerated geospatial analytics are delivering these insights at a scale and resolution that, until now, simply didn’t exist.
Moreover, census data is ripe for cross-referencing with other repositories. One of the most promising applications for this combined approach involves digital twinning—the construction of a “virtual duplicate” that mirrors the three-dimensional configuration, physical properties, and environmental conditions surrounding a real-world object or place.
Understanding the impact of the natural environment on populations, and vice versa, can change the direction of public policy, environmental management, disaster relief, homeland security and emergency services. Knowing at a moment’s notice, for example, what specific populations will be impacted by a hurricane, wildfire or other disaster can save lives, e.g., who on a street is disabled, or the languages spoken in a given neighborhood. Digital twinning also supports better utility planning, cellular and public Wi-Fi deployment, even forestry and park services planning.
One Household, One Dot
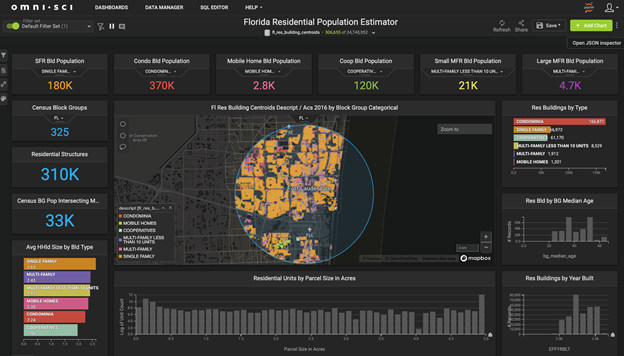
When census data is combined with parcels and buildings data, we can combine visualizations of population demographics and built form and property values. This too generally requires GPU analytics, both for the geoenrichment and for rendering. For example, Florida has more than 16 million parcels, and at national scale, the open dataset of Microsoft Building Footprints contains approximately 150m features. This is simply not feasible to process with conventional desktop tools, but is easily done with modern GPU hardware and appropriate software.
This kind of hybrid dataset has two strong advantages. First, it gives a much more accurate spatial picture of actual residential locations. This is particularly valuable in lower density locations like rural residential areas, where census block groups may not correspond with built locations. For example, commercial and industrial areas, wetlands and parks are all included within census geographies, but are not normally inhabited places. When combining environmental risk maps, such as fire or flood risk, it often becomes important to understand where residential buildings are actually situated within a large census block group.
The second advantage is socioeconomic. In states or areas with large retirement populations, such as Florida, census median income figures do not reflect consumer purchasing power nearly as well as measures including parcel values.
A Historic Development
Dot density and building-level maps of the U.S. Census, powered by GPU-based analytics in the cloud and delivered via online dashboard, have the potential to democratize our largest national demographic database like never before. From business to academia, public safety to social services, accelerated analytics is giving every kind of user the ability to better understand our nation in ways as dynamic, diverse, rich—and numerous—as the census count itself.


