

Every year, more and more components are placed onto the newer circuit boards in less space for better performance and reliability. Smaller than a credit card, a single phone motherboard contains hundreds of parts.
If one of them fails, it’s too much work to locate it visually or using only one point probe on the multimeter. Visualizing the thermal data resolves all the problems by instantaneously converting the entire board into a readable heat map in seconds.
This article examines how thermal data visualization works, its ability to speed diagnostics on dense circuitry, and the tools techs use to achieve accurate results.
Key Takeaways
- Thermal data visualization rapidly converts circuit board temperatures into a color-coded heat map, identifying faulty components efficiently.
- High-density boards require faster diagnostics due to closely packed components, making manual testing complex and risky.
- AI enhances thermal data analysis by automatically identifying faults based on known patterns, saving significant time.
- Common faults detected through thermal visualization include short circuits and overheated ICs, which produce distinct heat patterns.
- Thermal data significantly reduces repair time by allowing quick scans, improving turnaround without sacrificing diagnostic accuracy.
Table of contents
What Thermal Data Visualization Actually Shows
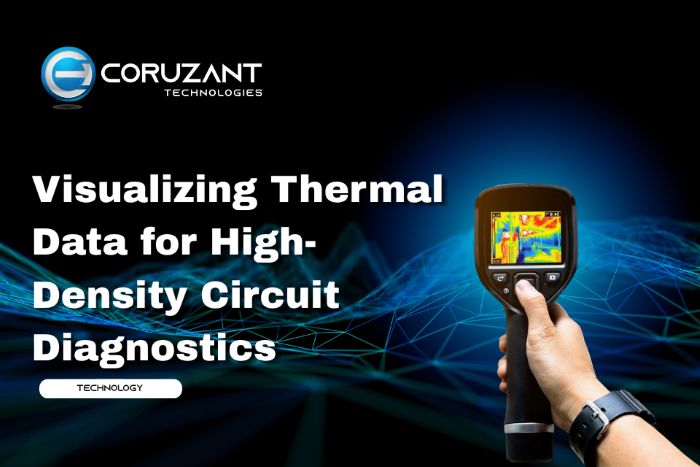
A reader with an infrared sensor measures the temperature at each point on the circuit board and maps it to a color gradient. Higher-temperature parts of the image turn to a bright red, orange, or white, and cooler parts turn to a shade of blue or black. This gradient provides a quick visual indication to the technician of where the current is going out of norm.
This visualization is powerful because of the context. One hot part doesn’t necessarily signal a problem, but if one reading is hot and other readings are cool and normal, it will indicate a problem. This contrast is the speedup over checking each component separately, which makes thermal visualization faster.
Why High-Density Boards Demand Faster Diagnostics
With the shrinking size of the chip packaging, designers have to pack in more functions into a smaller footprint on boards. This density helps to enhance the device’s performance but makes manual diagnostics more complex as traces and components are closer to each other and more easily damaged during physical testing.
A ShortCam III imaging camera combines a scan of the entire board surface without physical contact. The dual-lens feature superimposes a thermal reading with a clearly visible one, which allows technicians to see the exact location of the component when connected with each thermal reading, rather than an opaque blob where the heat is measured.
The Diagnostic Workflow in Practice
In a high-density board, a typical procedure for the technician to perform is to take raw heat data and reach a conclusion that a fault has occurred:
- Position and secure board(s) and plug them into an amp with control.
- Take a heat map over the entire surface to create a heat map.
- Examine live reading with a known good reading board or baseline.
- Use software to alert you to components whose readings are beyond normal temperature ranges.
- Perform a secondary diagnostic on the flagged component.
Having a dedicated Phone Fault Diagnostic Tool that overlays the schematic for a thermal scan gives the technician an unparalleled benefit in this workflow, since it connects the thermal scan to a component identifier without requiring a manual cross-check of multiple systems.
Where AI Adds Speed to the Process
Even for an experienced thermographer, reading a thermal map requires some experience; not all hot spots are faults. With some components, the load causes a normal hot state, even during normal operation. This is what pattern recognition software can do for you. AI Current Analysis Phone repair identifies true anomaly (abnormal) current readings by comparing them with libraries of known fault signatures and automatically differentiates them from natural current.
This becomes particularly advantageous when dealing with boards of a hundred or more similar components that have similar aesthetics, as it would otherwise take several hours to review them each manually, checking their operating temperature compared with the known environment.
Common Faults Found Through Thermal Visualization
Ionic fault detection is more successful in identifying certain fault types than any other diagnosis technique, and these are:
- Short Circuits between adjacent Solder Pads
- ICs handling power delivery when only part of the load is placed on them operate at hot temperatures
- Leakage caused by corrosion due to liquid contact.
- Cold solder joints under packages (BGA and CPU)
- Overcharging circuits.
These each result in a different heat pattern that, when clearly perceived, can be differentiated from the normal board operation.
Reducing Repair Time With Better Data
The absolute plus of thermal imaging of complex circuits is time. A complete board scan is performed in seconds, checking each part in one measurement instead of minutes per point using manual probing. This distinction can mean a much quicker turnaround time without compromising on diagnostics for a repair shop that processes a lot of devices.
Coordinated utilization of visual thermal data also establishes a benchmark library over time and lets shops identify common trouble spots on board revisions and adequately train new technicians by providing a real sample of the board instead of a theoretical one.
Conclusion
Thermal visualization is a key tool in today’s diagnosis of faults for the high-density micro-circuitry. Technicians make the failed parts of the equipment appear right away on the clear, color-coded map to save repair time, thereby increasing their accuracy.
This trend towards a visual method of diagnostics will continue to play an integral role in fast and reliable hardware repair as boards grow more compact and cramped with additional functions.
FAQs
1. What does visualizing thermal data mean in hardware diagnostics?
It means converting infrared temperature readings from a circuit board into a color-coded map, making it easy to spot components that run hotter or cooler than expected.
2. Why is thermal visualization especially useful for high-density boards?
Dense boards are those that fit components tightly together, which can lead to inefficient manual testing, as trying to get to each point becomes time-consuming and hazardous. A full surface scan is a type of scan that is completed without touching any surface for fault detection.
3. How does AI improve thermal fault detection?
AI can be used to compare live thermal readings with fault patterns and automatically flag elements that are running at an actual fault level while rejecting ones that are running warm but are normal.
4. What faults show up most clearly through thermal visualization?
The most common include micro-short circuits and overheated power ICs, corrosion damage, cold solder joints, and/or charging circuit failure.
5. Does thermal visualization replace schematic-based diagnostics?
No, it is an addition to it! A thermal map helps narrow down the fault area, and the schematic is used to determine which component is being ruined.
6. Is a dual-lens thermal camera necessary for accurate diagnostics?
It does a lot of help, as it’s so much easier to locate a precise fault item when overlaying a thermal reading on a visible image.
7. How much time can thermal visualization save during repair?
Tests can be performed in a fraction of a second with a complete board scan, versus standard manual testing that takes minutes, and can mean a significant time savings when dealing with greater volumes of repair.