


Gartner published its first Magic Quadrant for Customer Journey Analytics and Orchestration on 23 March 2026, evaluating ten vendors against five mandatory capabilities (Source: Gartner).
A category only gets its own Magic Quadrant once enterprise buyers are spending seriously and getting the purchase wrong often enough to need help.
Most of what you find when searching for customer journey analytics examples is a list of software products. That is not an example. An example is an analysis somebody ran, what it showed, and what the team did differently afterward. Seven of those are below, along with the category distinction that causes more failed evaluations than any feature gap.
Key Takeaways
- Journey analytics connects behavior across channels, not just digital ones.
- Product analytics tools are explicitly excluded from Gartner’s journey category.
- The most valuable analyses expose failures no single channel report shows.
- Deterministic identity matching is the capability everything else depends on.
- Buy for the channels in your journey, not the dashboard you liked.
Table of contents
What separates journey analytics from the reporting you already run
Gartner defines the category as solutions that track and analyze how customers interact with an organization across multiple channels over time, then let organizations prioritize and orchestrate real-time improvements to those journeys. The five capabilities a vendor must have to qualify are source-agnostic data capture, journey visualization, deterministic customer identity matching, journey prioritization and outcome management, and journey orchestration.
Read the first and third of those again, because they carry the weight.
Source-agnostic means the platform cannot be limited to digital channels. Phone calls, store visits, and chat transcripts have to land in the same dataset as web sessions. Deterministic identity matching means connecting records through known identifiers so you can follow one person across all of it rather than a cookie across one property.
Web analytics tells you what happened on your site. Journey analytics tells you what happened to a customer. Those sound similar until you run the analyses below, at which point they stop sounding similar at all.
Seven customer journey analytics examples
1. The handoff that fails between app and contact center
You have an app completion rate and a call center volume report. Both look normal. What neither shows is the population that starts a task in the app, abandons it, and calls within the hour.
The analysis connects app session data with call records through a customer identifier, then filters for calls occurring within a short window of an abandoned session. What surfaces is a specific screen, usually one with a validation error or an unclear requirement, generating a measurable share of your inbound volume.
The output is not a dashboard. It is a ranked list of screens by calls generated, which turns a UX backlog item into a cost line with a number attached.
2. Repeat contact analysis on self-service failures
Deflection rates are among the most misleading metrics in customer service – a chatbot session that ends without escalation counts as deflected, whether the customer got an answer or gave up.
Journey analytics reframes the question. Instead of asking whether the session ended, you ask whether that customer contacted you again through any channel in the following days. The gap between the deflection rate and the genuine resolution rate is frequently uncomfortable.
Teams that run this analysis typically stop optimizing for containment and start optimizing for whether the issue actually closed.
3. Intended onboarding path against actual onboarding path
Every onboarding flow has a design. Very few have been checked against what users do.
Visualize the real sequences, usually as a Sankey diagram, and you see the loops. People skipping a step and returning to it two sessions later. People completing setup in a different order than designed. A branch nobody anticipated carrying substantial traffic.
The useful finding is rarely where people drop out. It is where they detour, because a detour means your sequence assumed knowledge the customer did not have at that moment.
4. Silent failures after a release
Some breakages announce themselves. Others just quietly stop a subset of customers from finishing something, and no alert fires because the error rate is technically unchanged.
Set journey completion rates as the monitored metric, segmented by device, region, and account type, and you catch the release that broke a flow for one browser version or one class of account. Without the journey lens, this shows up weeks later as a churn number nobody can explain.
Journey monitoring belongs in your release process, not just your quarterly review.
5. Journey-level attribution against last-touch
Last-touch attribution credits whatever happened immediately before the conversion. It is the reason branded search and retargeting always look like your best channels.
A journey view assembles the whole sequence: which touchpoints appeared, in what order, and how the sequence differs between customers who converted and customers who did not. Order matters more than most models allow. A webinar early in a journey and the same webinar late in one are doing entirely different jobs.
The result usually reallocates budget away from whatever was closest to the finish line.
6. Retention divergence traced back to week one
Take two cohorts with different twelve-month retention and walk backward through their journeys until they diverge.
The split almost always appears earlier than expected, often within the first week and often at a single action: a feature activated, a support conversation resolved a particular way, an integration connected. Once you know which action separates them, you have a target for onboarding and for predictive models of customer behavior that actually points at something you can change.
This is the analysis that most reliably survives contact with a skeptical executive, because it connects a specific early behavior to a revenue outcome.
7. Where offline and online stop connecting
A customer researches online, buys in store, then contacts support through chat. Three systems, three identifiers, one person.
The analysis measures how often you successfully connect those records and where the connection breaks. Guest checkout, phone orders taken by an agent, and any journey involving a shared household account are the usual failure points.
You are looking for the percentage of journeys you can follow end to end. If that number is low, every other analysis on this list is running on partial data, which is the most important thing journey analytics can tell you in its first month.
The category confusion that derails most evaluations
Here is what the search results will not tell you, and it explains a lot of disappointing purchases.
Gartner’s inaugural Magic Quadrant explicitly excludes digital, web and product analytics tools from the customer journey analytics category. The stated reason is that these vendors analyze digital product behavior but are not built to ingest the full spectrum of digital, physical, and analog customer interactions. Journey mapping tools that do not ingest event data are excluded too, as are multichannel marketing hubs whose primary job is executing campaigns.
The vendors Gartner did evaluate are Adobe, Alterian, CallMiner, CSG, Engage Hub, inQuba, Joulica, Medallia, and Woopra.
Notice who is absent. The product analytics platforms that dominate the search results for this topic are not in the category at all, because they cannot see the phone call in example one or the store visit in example seven. They are excellent at what they do. What they do is a different job.
So there are effectively two product families sharing one name:
Journey analytics and orchestration ingests cross-channel interaction data alongside transactional, voice of the customer, and profile data, then acts on it in near real time. Contact center and CX lineage. This is Gartner’s category.
Digital and product analytics analyzes behavior within web and app properties in depth, with strong experimentation and funnel tooling. Product and growth lineage.
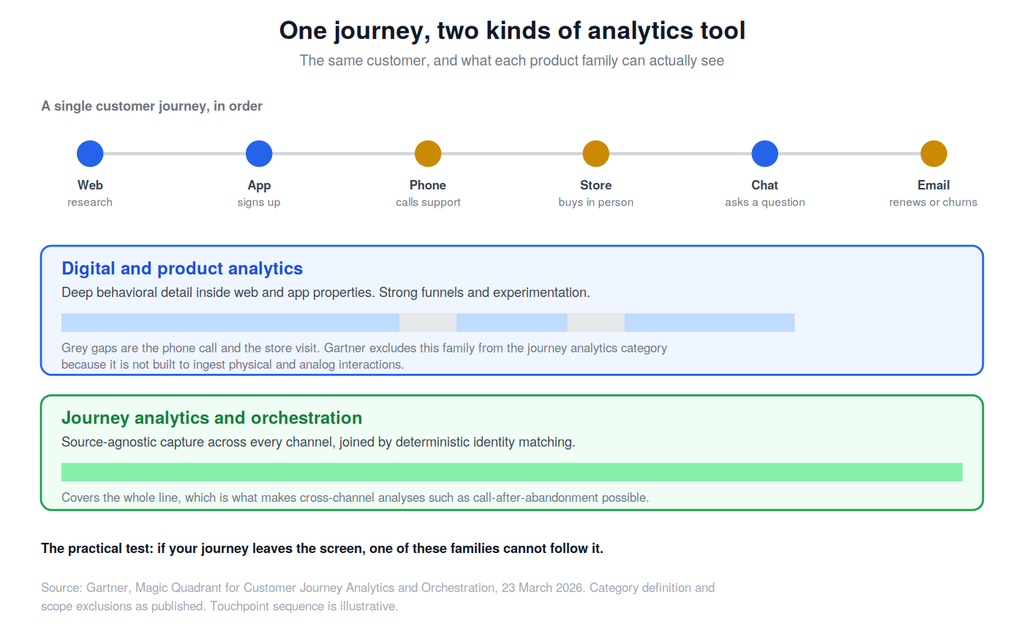
If your journey genuinely runs through phone, branch, or field channels, a product analytics tool will produce a confident and incomplete picture. If your journey is entirely in-app, a full journey platform is heavier than you need. Most bad evaluations are a mismatch between these two, not a missing feature.
Which platforms actually fit the category
Match the tool family to your channel mix first, then compare products within that family.
For cross-channel journeys spanning service, marketing, and physical touchpoints, look at the vendors in Gartner’s evaluation, with Adobe and Medallia the most widely deployed among enterprise buyers and CSG, inQuba, and Alterian competing as specialists. CallMiner and Joulica come from conversation and contact center analytics, which shows in where they are strongest.
For digital-only journeys, the product analytics tools remain the right answer, and nothing about the Magic Quadrant changes that.
One practical note on evaluation. Gartner weights customer experience and product capability highly on the execution axis, and sales strategy, product strategy, and innovation highly on the vision axis. Those weightings tell you what the analysts were optimizing for, which may or may not match what you are optimizing for. Read the criteria before you read the picture.
What has to be true before any of this works
Every example above depends on connecting records for the same person across systems. That is the project, and it is usually underestimated.
Data silos are the standard obstacle, and the standard response of building a comprehensive data lake first tends to delay value by quarters. Starting from a single use case and working backward to the data it requires gets you to a result faster, an approach one analytics leader describes as building data ponds before data lakes.
Pick example one or example seven. Both need a narrow slice of data, both produce a number an executive can act on, and both tell you immediately how good your identity matching really is.
Conclusion
The customer journey analytics examples worth your time share a shape. Each one connects something that was already being measured in two places to something that was not being measured at all, and each produces a decision rather than a chart.
Start with one journey and one question. Confirm you can follow a real person across the systems that journey touches. If you can, the analyses compound quickly. If you cannot, you have found the actual project, and it is a better use of the next quarter than a platform evaluation.
Keep reading for more on analytics and AI in customer operations:
- 3 Banking Processes That AI Can Automate Without Touching the Core Banking System
- AI Agents: Choosing the Right Partner
- The Best Context Management Platforms for AI Agents
Frequently Asked Questions
Customer journey analytics tracks and analyzes how customers interact with an organization across multiple channels over time, combining interaction data with transactional, feedback, and profile data on a time axis. It then supports prioritizing and orchestrating improvements to those journeys in near real time.
Common examples include identifying app abandonments that generate support calls, measuring whether self-service sessions actually resolved the issue, comparing designed onboarding paths against real ones, detecting silent failures after a release, attributing revenue across whole journeys rather than last touch, and tracing retention differences back to a specific early action.
Web analytics measures behavior within a site or app, organized around sessions and pages. Journey analytics organizes around a person and follows them across every channel including phone, store, and chat, which requires deterministic identity matching and source-agnostic data capture.
You need event data from every channel in the journey, a reliable identifier that connects records for the same person across those systems, and ideally transactional and customer feedback data to layer on top. Identity resolution quality determines how much of the rest is usable.
Marketing, customer service and support, CX, product, and B2B sales teams all use it, typically for different questions. Large enterprises usually expect cross-functional value, while midsize organizations more often deploy it for a single function first with a narrow scope.