
Every single day, the world generates an astonishing amount of data. This constant flood of information puts incredible pressure on businesses to move beyond simple intuition. Gut feelings are valuable, but they are no longer enough to compete and win.
The core challenge for any modern company is turning this vast sea of raw data into smart, strategic actions. How do you find the hidden signals in the noise? How do you make choices that are backed by evidence, not just assumptions?
This guide will show you how. We will explore the powerful connection between business intelligence and decision-making. You’ll learn the core strategies, the essential tools and techniques, and a practical roadmap to transform your organization’s data into its greatest asset.
Key Takeaways
- Data-Driven Decision Making (DDDM) focuses on making choices based on hard data instead of gut feelings.
- A Single Source of Truth (SSOT) is essential for consistent decision-making and is built through data integration.
- Business Intelligence (BI) transforms raw data into actionable insights, enhancing decision-making processes.
- Key benefits of BI include improved operational efficiency, competitive advantage, and better risk management.
- A successful BI implementation requires defining clear goals, ensuring data quality, and fostering a data-driven culture.
Table of contents
- What is Data-Driven Decision Making (DDDM)?
- The Role of Business Intelligence in Decision Making
- From Raw Data to Actionable Insight: The BI Process
- The 3 Tiers of Analytics: From “What” to “What’s Next”
- Key Benefits of a BI-Led Decision-Making Strategy
- Core Business Intelligence Techniques for Effective Analysis
- Choosing Your Platform: Business Intelligence Tools & Features
- Your Roadmap: Implementing a BI Strategy for Better Decisions
- Common Challenges to Overcome in BI Implementation
- Conclusion
- Frequently Asked Questions (FAQ)
What is Data-Driven Decision Making (DDDM)?
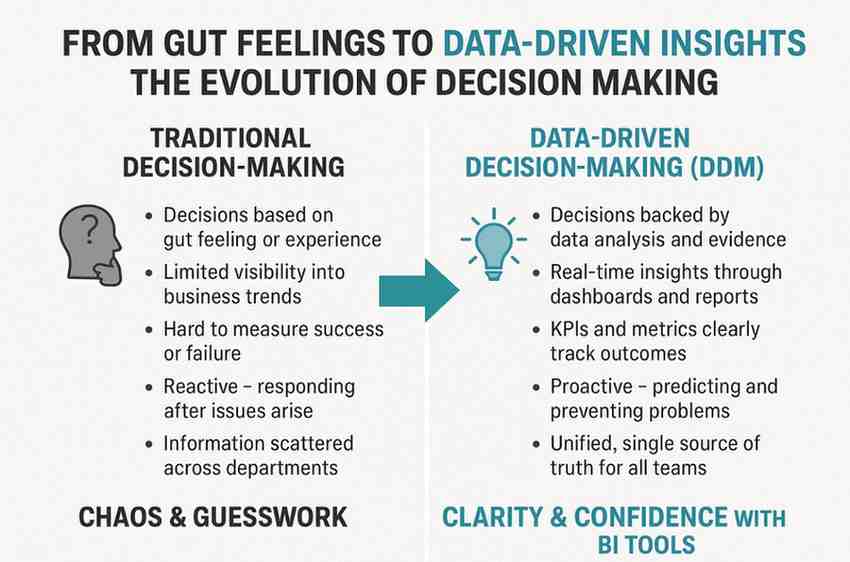
Data-Driven Decision Making (DDDM) is the practice of making choices based on hard data and analysis. It’s a shift away from relying solely on experience or opinion.
Think of it this way:
- Traditional decisions might be based on what a manager thinks is the best-selling product.
- Data-driven decisions are based on what the sales reports prove is the best-selling product.
This approach removes guesswork and grounds your strategy in reality.
For DDDM to work, you need one critical thing: a Single Source of Truth (SSOT), which is typically built and maintained through data warehouse consulting services that centralize and standardize enterprise data. This means everyone in the organization is looking at the same, consistent, and trusted data. Without it, different teams make different decisions based on conflicting information, leading to chaos.
The Role of Business Intelligence in Decision Making
So, how do you build that Single Source of Truth and enable data-driven choices? The answer is Business Intelligence (BI).
Business Intelligence is the technology and processes that enable a company to practice DDDM effectively. It’s the engine that powers smart decisions.
At its heart, business intelligence and decision making are two sides of the same coin. BI provides the “what,” so you can decide “what’s next.”
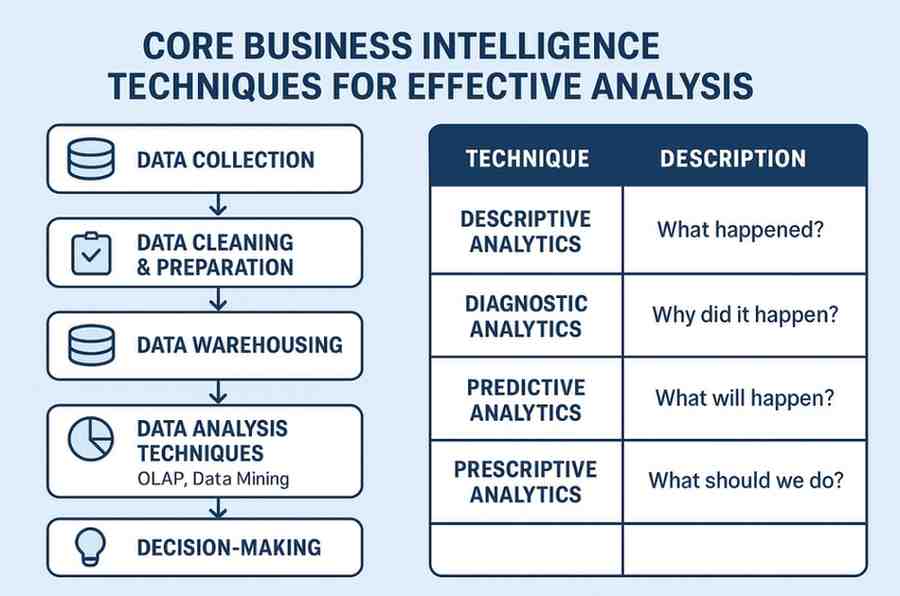
From Raw Data to Actionable Insight: The BI Process
The BI process looks complicated from the outside, but it follows a simple, logical flow. It takes messy, raw data and turns it into clean, useful insights.
- Collect Data: BI systems pull information from all your different sources. This includes your CRM (like Salesforce), your ERP system, financial software, and marketing platforms.
- Process Data: The raw data is then cleaned and organized. This is often done through a process called ETL (Extract, Transform, Load). It makes sure the data is accurate and ready for analysis.
- Present Insights: Finally, the processed data is presented in a way that humans can easily understand. This is where you see beautiful dashboards, charts, and interactive reports.
The 3 Tiers of Analytics: From “What” to “What’s Next”
Business intelligence uses different types of analytics to answer different kinds of questions. Understanding these tiers helps you see the full power of BI.
- Descriptive Analytics (What happened?): This is the most common type. It looks at past data to tell you what happened. For example, a sales report showing your revenue for the last quarter.
- Predictive Analytics (What will happen?): This tier uses historical data, statistics and Machine Learning to forecast future outcomes. It might predict next month’s sales or identify which customers are likely to churn.
- Prescriptive Analytics (What should we do?): This is the most advanced tier. It not only predicts what will happen but also recommends a course of action to achieve a desired outcome. For example, it could suggest the optimal price for a new product.
Key Benefits of a BI-Led Decision-Making Strategy
When you fully embrace business intelligence in decision-making, the results can transform your entire organization. It’s not just about having nice-looking charts; it’s about driving real business outcomes.
Enhance Operational Efficiency and Reduce Costs
BI dashboards can shine a light on hidden inefficiencies. You might discover a bottleneck in your supply chain or identify which marketing campaigns are wasting money.
By seeing exactly where resources are going, you can make precise adjustments to streamline operations and cut unnecessary costs.
Gain a Significant Competitive Advantage
What are your competitors doing? Where is the market heading? BI helps you answer these questions.
You can analyze market trends, track competitor pricing and spot new opportunities before anyone else. This allows you to be proactive and strategic, rather than just reacting to what others do.
Uncover Deeper Customer Insights
Your customers leave a trail of data with every interaction. BI helps you connect those dots.
You can understand purchasing patterns, identify your most valuable customer segments and see what drives customer loyalty. This knowledge allows you to create better products, deliver personalized experiences, and build stronger relationships.
Improve Risk Management and Mitigation
Every business faces risks, from financial instability to operational disruptions. BI acts as an early warning system.
By monitoring key metrics and Key Performance Indicators (KPIs) in real time, you can spot potential problems before they become crises. This gives you the time to mitigate risks and protect your business.
Core Business Intelligence Techniques for Effective Analysis
To generate these powerful insights, BI platforms rely on a set of core techniques. These are the analytical methods working behind the scenes to make sense of your data.
Data Mining & Online Analytical Processing (OLAP)
Data Mining is the process of sifting through massive datasets to discover hidden patterns, trends, and relationships. It’s like being a detective for your data, uncovering clues that aren’t obvious on the surface.
Online Analytical Processing (OLAP) is the technology that enables this exploration to be fast and easy. It allows you to “slice and dice” your data from multiple angles. For example, you could view sales by region, then by product, then by salesperson, all within seconds.
Predictive Analytics powered by AI and Machine Learning
This is where BI gets really smart. By using Artificial Intelligence (AI) and Machine Learning algorithms, BI tools can make highly accurate forecasts.
These techniques learn from your historical data to predict future events. This is the magic behind sales forecasting, customer churn prediction and demand planning.
Data Visualization, Dashboards, and Interactive Reporting
A spreadsheet full of numbers is hard to understand. A chart or a map is intuitive. Data Visualization is the art and science of presenting data visually.
Modern BI is built around interactive dashboards that bring data to life. Users can click, filter, and drill down into the data themselves, asking and answering questions on the fly. This is a core component of Self-Service BI.
Real-Time Analytics vs. Ad Hoc Analysis
BI supports two key modes of analysis:
- Real-Time Analytics: This provides up-to-the-second insights, which is crucial for monitoring things like website traffic, factory production, or stock levels.
- Ad Hoc Analysis: This is when a user wants to answer a specific, one-time question. They can build a custom report or query to get the exact answer they need, without waiting for the IT team.
Choosing Your Platform: Business Intelligence Tools & Features
The right technology is crucial for bringing your BI strategy to life. The market is full of powerful business intelligence tools and techniques, but they are not all created equal.
So, what should you look for?
Must-Have Features in a Modern BI Platform
A unified data integration tool should seamlessly connect to all data sources, whether they are cloud-based or on-premises. This includes compatibility with leading cloud platforms such as Snowflake and Google BigQuery, as well as traditional databases hosted within an organization’s infrastructure. Additionally, the platform should feature augmented analytics capabilities, leveraging built-in AI and machine learning to automate the discovery of insights and streamline data preparation processes.
As data volumes and user demands increase, a cloud-native architecture ensures scalability without the need for substantial upfront hardware investments. Finally, robust data governance is an essential comprehensive feature for data quality management, security, and compliance, helping organizations maintain a single source of truth and ensure that data remains reliable, protected, and consistent across all systems.
A Comparison of Top BI Tools for 2024
While many great tools exist, a few leaders dominate the market. Here’s a quick look at some top choices:
- Microsoft Power BI: A market leader known for its user-friendly interface and deep integration with the Microsoft ecosystem, including Azure and Office 365. It’s an excellent choice for organizations already invested in Microsoft products.
- Tableau (a Salesforce company): Famous for its powerful and beautiful Data Visualization capabilities. It’s a favorite among data analysts for its flexibility and strong community support.
- Looker (part of Google Cloud): A modern, web-based platform that excels at creating a reliable data modeling layer (LookML). It’s ideal for companies that want to build a strong, governed data culture and integrate with Google BigQuery.
Businesses using Oracle NetSuite can also benefit from NetSuite Consulting Services, which ensure BI and ERP systems work together seamlessly, enabling smarter reporting, unified data analytics, and greater visibility across finance, sales, and operations.
Your Roadmap: Implementing a BI Strategy for Better Decisions
Having a great tool is just one piece of the puzzle. A successful implementation requires a clear plan. At Big Bang, we guide our clients through a strategic roadmap to ensure they get real value from their investment.
Step 1: Define Clear Business Goals and Key Performance Indicators (KPIs)
Don’t start with the data; start with the business. What questions do you need to answer? What problems are you trying to solve? Define specific, measurable goals and the KPIs you will use to track progress.
Step 2: Establish Data Governance and Ensure Data Quality
This step is non-negotiable. You must create rules and processes for managing your data. Focus on ensuring your data is accurate, complete and consistent. Remember: garbage in, garbage out.
Step 3: Select the Right BI Tool and Integrate Your Systems
Based on your goals and technical needs, choose the BI platform that fits best. The next task is to connect it to your key data sources. This is where you technically build your Single Source of Truth. For many businesses, working with specialised ERP Implementation and Consulting Services can be a critical part of this step, ensuring seamless integration with their existing enterprise systems.
Step 4: Foster a Data-Driven Culture Through Training and Empowerment
Technology alone doesn’t create change. You need to invest in your people. Provide training to improve Data Literacy across the organization. Empower teams to use the new tools to explore data and make their own informed decisions.
Step 5: Start Small, Iterate, and Measure ROI
Don’t try to boil the ocean. Start with a single department or a specific business problem. Build an initial dashboard, gather feedback, and demonstrate value quickly. This creates momentum and helps you prove the return on investment (ROI) as you expand the initiative.
Common Challenges to Overcome in BI Implementation
The path to data-driven decision making has a few common roadblocks. Being aware of them is the first step to overcoming them.
Overcoming Data Silos and Integration Complexity
Most companies have data scattered across dozens of disconnected systems. These “data silos” prevent you from getting a complete picture of the business. Breaking them down through careful integration is a primary and often complex challenge.
Managing Data Quality and Consistency
Inaccurate or inconsistent data is the number one killer of BI projects. A customer might be listed as “John Smith” in one system and “J. Smith” in another. A formal Data Governance and Master Data Management (MDM) program is essential to fix these issues.
Driving User Adoption and Improving Data Literacy
People are often resistant to change. Some may feel intimidated by new tools or distrust the data. A successful BI program requires strong leadership, ongoing training, and a focus on showing teams how data can make their jobs easier, not harder.
Conclusion
The link between business intelligence and decision making is clearer and more critical than ever. BI is the framework that transforms raw, confusing data into clear, actionable insights. It’s achieved through a combination of powerful techniques, user-friendly tools and a smart, step-by-step strategy.
Implementing a BI strategy is not just a technical project; it’s a cultural shift. By putting the right data and tools into your teams’ hands, you empower them to move beyond guesswork and make confident, evidence-based decisions that unlock sustainable growth and secure a competitive edge.
Frequently Asked Questions (FAQ)
Q1: What is the primary purpose of business intelligence in decision-making?
A1: The primary purpose of business intelligence (BI) is to transform raw data from various business systems into actionable insights. This enables leaders and teams to make informed, evidence-based decisions that improve operational efficiency, identify new opportunities and reduce risks, rather than relying on intuition.
Q2: What is an example of a data-driven decision using BI?
A2: A retail company using a BI dashboard to analyze sales data might notice a specific product is selling poorly in one region but extremely well in another. Instead of a blanket discount, they can make a data-driven decision to reallocate inventory to the high-performing region and run a targeted marketing campaign in the underperforming one, optimizing both sales and marketing spend.
Q3: What are the four main types of business intelligence analytics?
A3: The four main types are:
- Descriptive Analytics: What happened? (e.g., last quarter’s sales report)
- Diagnostic Analytics: Why did it happen? (e.g., drilling down to see why sales dropped)
- Predictive Analytics: What is likely to happen? (e.g., forecasting future sales based on trends)
- Prescriptive Analytics: What should we do about it? (e.g., recommending optimal pricing)
Q4: How do I get started with implementing a BI strategy?
A4: Start by defining a clear business question you want to answer (e.g., “Where are we losing customers?”). Then, identify and audit your data sources for quality. Begin with a user-friendly BI tool like Microsoft Power BI or Tableau to connect to your data, create simple visualizations and dashboards, and empower a small team to start exploring the insights.


