

Instagram analytics changed more between 2023 and 2026 than in the eight years before it, and most guides still walking you through the old dashboards are describing software that no longer opens. US social media creator revenue will grow 16.2% to $20.6 billion in 2026 (Source: eMarketer), which is a large amount of money riding on measurement that a lot of people are doing against retired tools.
Instagram crossed 3 billion monthly active users in September 2025, its first user disclosure since 2022. Reach at that scale is decided by a ranking system that weighs a specific and publicly stated set of signals, none of which are the metrics most dashboards put at the top. Here is what exists, what it measures, and what to do with it.
Key Takeaways
- Creator Studio was shut down and folded into Meta Business Suite in 2023.
- IGTV no longer exists, so IGTV metrics and ad revenue are obsolete.
- Watch time, likes per reach, and sends per reach are the named ranking signals.
- Native Instagram analytics retain only 90 days of history, so export monthly.
- Buying followers damages every ratio metric the algorithm actually reads.
Start with what Meta removed
Three products that appear constantly in Instagram analytics advice are gone.
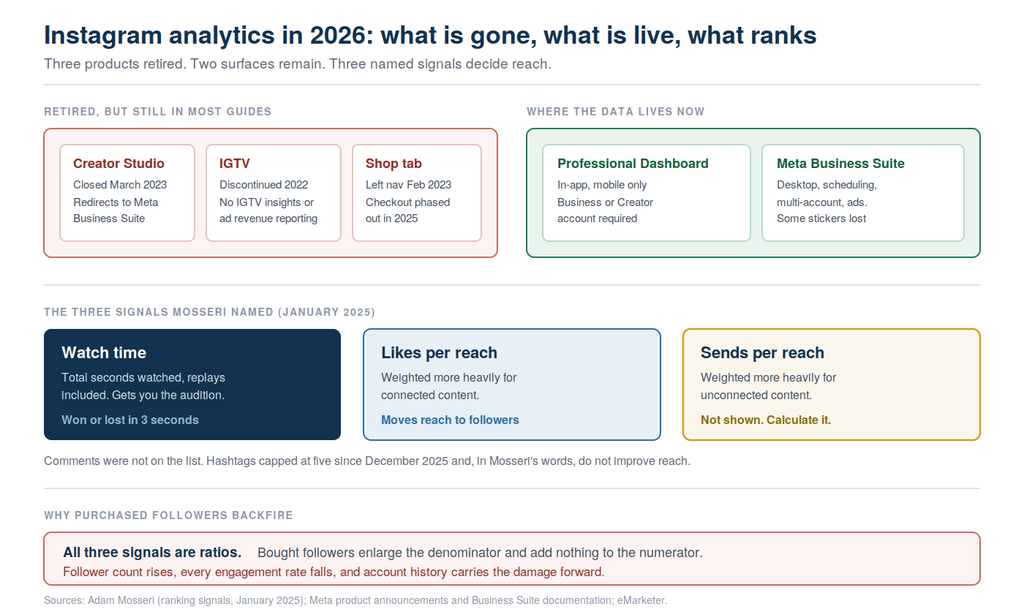
Creator Studio was wound down beginning in late 2022 and closed in March 2023, redirecting to Meta Business Suite. All scheduling, insights, and monetization tooling migrated. There is no path back and no plan to revive it.
IGTV was discontinued in 2022. IGTV Insights, IGTV ad revenue, and IGTV eligibility checks do not exist as separate things. Long-form video lives inside Reels now, with the duration limit extended well past the original short-form cap.
The Shop tab left Instagram’s navigation bar in February 2023, taking the Shopping Explore surface with it. Live Shopping was discontinued and product tags in live video stopped working. Native in-app checkout was fully phased out across US merchants during 2025, which means product performance data inside Instagram no longer includes completed purchases the way it once did.
If a guide is walking you through Creator Studio to check IGTV performance and Shopping Explore visibility, it was written before 2023 and nothing in it is safe to act on.
Where Instagram analytics actually live
Two surfaces, split by device and by depth.
Professional Dashboard, in the app
This is the primary home for Insights, and it remains mobile-first. You need a Business or Creator account; personal accounts do not get the full dataset. From your profile, open Professional Dashboard, then Insights. Some scheduling and trending-audio features opened to public accounts during 2026, but the analytics still require the account switch.
If you convert an account and Insights appears empty, give it up to 24 hours to populate before assuming something broke.
Meta Business Suite, on desktop
Business Suite absorbed everything Creator Studio did and added cross-posting, ads integration, A/B testing, and a shared inbox across Facebook and Instagram. It is the right place for scheduling, for managing several accounts, and for anything a client will see.
One practical limitation worth knowing before you build a workflow around it: Stories scheduled through the desktop suite lose access to some interactive stickers, including polls and question boxes. If sticker engagement is part of your Story strategy, those posts need to go out natively.
Creators who want visibility beyond Instagram’s native metrics can also use Linklay, a link-in-bio platform that provides analytics on clicks and audience behavior while routing followers to multiple destinations from one profile link.
The metrics that moved during 2026
Instagram expanded Reel-level reporting through 2026, and the additions are more useful than anything in the older dashboards.
The most valuable is behavioral rather than volumetric. Skip rate shows viewers who scrolled past before the Reel played meaningfully, which turns a vague “the hook is weak” instinct into a number. Share-rate reporting exposes how often a Reel gets sent onward rather than merely liked. Views-over-time data tracks performance across days and weeks instead of collapsing it into a single figure, which matters because Instagram now surfaces content well past the first 48 hours. Post-watch behavior shows what a viewer did next: visited the profile, followed, engaged further, or moved on.
Availability varies by account type and region, so check what your own dashboard actually exposes rather than assuming parity with what you read.
The three signals Instagram has actually named
This is the part worth internalizing, because it is stated policy rather than inference.
In January 2025, Instagram head Adam Mosseri named the signals that matter most for ranking: watch time, likes per reach, and sends per reach. He added a refinement that changes how you should read your own numbers. Likes matter more for connected content, meaning distribution to your existing followers. Sends matter more for unconnected content, meaning recommendations to people who do not follow you.
Comments were not on the list.
The practical consequence is that two accounts with identical follower counts can have completely different growth trajectories depending on which ratio they optimize. A post that earns follower likes gets respectable reach and stalls, because it never generates the send signal that pushes content to strangers. Watch time gets the audition. Sends get the scale.
Sends per reach is not displayed as a labeled metric, so calculate it. Open a post’s insights, divide sends by reach, multiply by 100. Track that number over time and you are tracking the thing most creators never look at.
Instagram also capped hashtags at five per post in December 2025, and Mosseri has said directly that hashtags do not improve reach. Use them for topical clarity if you want. Do not budget effort against them as a distribution tactic.
Why buying followers breaks your analytics
This deserves its own section because the advice persists and the mechanics have changed underneath it.
Every signal Instagram named is a ratio. Likes per reach. Sends per reach. Watch time relative to length. Purchased followers add to the denominator and contribute nothing to the numerator, because they do not watch, do not share, and do not buy. The result is a permanently depressed engagement ratio that the ranking system reads as evidence your content does not deserve distribution.
The follower count goes up. The reach goes down. And because Instagram weighs an account’s performance history, that damage compounds rather than resetting with the next post. If you are looking to improve your profile’s viewing experience and analytics, try Linklay.
There is also a compliance dimension. Purchased engagement violates platform terms, and separately, US rules on reviews and testimonials treat fabricated endorsement as deceptive with civil penalties attached. Neither of those is worth a vanity number.
The 90-day problem
Native Instagram analytics retain roughly 90 days of history. There is no year-over-year view, no multi-year trend, and no competitor data.
That is a hard constraint on anything strategic. If you want to compare this Q3 against last Q3, or show a client an eighteen-month trajectory, you have to export monthly and keep your own record. Build that into the calendar as a recurring task, because the data you did not export is simply gone.
Third-party platforms exist to solve this, and most of them are also selling you scheduling and competitive benchmarking. Evaluate them on whether you need the history and the cross-channel view, not on whether their dashboards look nicer than Instagram’s.
A measurement routine that fits real work
Weekly, look at a small set: reach split between followers and non-followers, sends per reach on your best and worst post, and watch time on Reels. Three numbers, ten minutes. The follower/non-follower split tells you whether you are growing or talking to the same room.
Monthly, export everything, calculate ratios rather than totals, and look at what your top three posts had in common. Format usually beats topic here. Reels drive discovery; carousels tend to drive saves and considered action.
Quarterly, look at whether your best-performing content is actually the content that produces business outcomes. High reach on entertainment content and low reach on product content is a common pattern, and it is a strategy problem rather than an analytics problem. The work of turning an audience into customers sits downstream of anything Insights can tell you.
Two things worth pairing with the numbers. Reels performance is largely decided in the first three seconds, so the structure of the video itself is where watch time gets won or lost. And production volume has changed enough that AI now handles much of the ecommerce creative workflow, which raises the value of measurement precisely because generating variants is no longer the constraint.
Conclusion
Instagram analytics in 2026 are better than they were and worse documented than almost any other major platform’s, largely because so much published advice predates three product shutdowns. Get your account on Professional Dashboard and Business Suite, learn the three named signals, and calculate sends per reach yourself since nobody displays it.
Then export monthly. The single most common failure in Instagram measurement is not misreading the data. It is not having the data at all, ninety days later, when someone asks what changed.
Read Next
More on the technology reshaping social and retail measurement:
- Augmented Reality Ecommerce in 2026: How AR Is Reshaping Online Shopping
- US Retail in the Age of Automation and AI
- 9 Best Real-Time Conversational AI Video Platforms
Frequently Asked Questions
Instagram analytics live in the Professional Dashboard inside the mobile app, under Insights, and require a Business or Creator account. Meta Business Suite provides the desktop equivalent along with scheduling, cross-posting, and multi-account management. Creator Studio, which older guides still reference, closed in 2023 and redirects to Business Suite.
Watch time, likes per reach, and sends per reach are the three signals Instagram head Adam Mosseri publicly named as most important. Likes carry more weight for reaching your existing followers, while sends carry more weight for reaching people who do not follow you. Comments were not included in that list.
Native Instagram analytics keep roughly 90 days of history, with no year-over-year comparison and no competitor data. Anyone who needs longer trends has to export monthly and maintain their own archive, or use a third-party platform that stores history independently. Data you did not export is not recoverable later.
No, it actively harms them. The ranking signals Instagram uses are ratios, so purchased followers inflate reach denominators while adding no watch time, likes, or sends, which pushes every engagement rate down. Purchased engagement also breaches platform terms and, where it involves fabricated endorsement, carries regulatory exposure.
Creator Studio was wound down from late 2022 and closed in March 2023, with all scheduling, insights, and monetization tools migrated to Meta Business Suite. IGTV was discontinued in 2022, so IGTV-specific insights and ad revenue reporting no longer exist. Long-form video now sits within Reels, measured through standard Reels analytics.