
When people think about reliable electricity, they usually imagine very physical things. Power lines. Substations. Transformers. Big switchboards in concrete rooms. All of that hardware still matters. But for many commercial and industrial businesses, something less visible is starting to matter just as much. It sits on top of the physical grid, comprising sensors, meters, gateways, and software that monitor power use. It analyzes patterns, spots trouble early, and suggests what to do before a problem halts production.
You could call this the invisible grid. It is the digital layer of data and insight that now decides whether a factory line keeps moving, cold storage stays cold, or a logistics hub can keep operating during a rough day on the grid. This shift is already influencing how regional engineering firms design and support energy systems. Companies like Solaren in the Philippines, which handle large commercial and industrial portfolios, now rely heavily on this digital layer to stabilize operations on sites with mixed loads, rooftop solar, and variable grid behavior.
This need becomes clearer when you look at how inconsistent reliability can be across developing grids. A 2024 peer-reviewed analysis of power-supply unreliability in South Asia found that outage durations ranged widely from about four days per year in some regions to nearly forty-two days per year in others. While Southeast Asia operates under different conditions, the pattern highlights a broader regional truth: traditional grids can vary significantly in stability, and even brief disruptions can have significant commercial and industrial consequences.
Key Takeaways
- The invisible grid combines physical infrastructure with sensors and software to enhance power reliability for commercial and industrial operations.
- Predictive analytics allows businesses to anticipate issues, reducing downtime and maximizing equipment lifespan.
- Companies like Solaren leverage predictive analytics to manage energy systems in regions with variable grid behavior, improving operational stability.
- Real-time data and insights from IoT help shift the focus from reactive alarms to proactive decision-making.
- Success in implementing predictive analytics lies in aligning technology with human expertise and local conditions.
Table of Contents
- Why power reliability has become a data problem
- What the invisible grid actually looks like
- Moving from alarms to foresight
- Three everyday situations where the invisible grid earns its keep
- Designing for the region, not for a brochure
- The human layer that makes it work
- Where is this heading for C and I users
Why power reliability has become a data problem
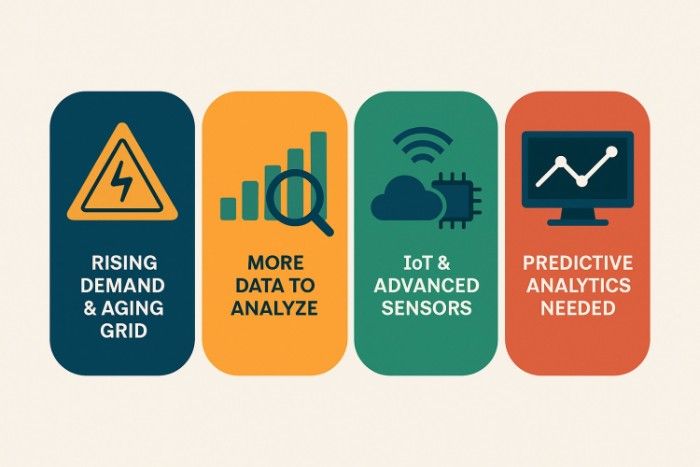
Across Southeast Asia, commercial and industrial users, often called C and I, live with a tricky mix of conditions. Electricity demand is growing fast. Many sites run long hours. Heat and humidity put extra stress on cables, switchgear, and cooling systems. On top of that, more businesses are adding rooftop solar, batteries, fast chargers, and automated equipment. A similar situation can be seen with Solaren in the Philippines, where growing solar adoption and long operating cycles contribute to the same reliability pressures found across the region.
The result is simple: There is more to go wrong.
A short dip in voltage at the wrong moment can stop a bottling line or cause a drive to trip. A chiller fault in a food facility can spoil inventory that took months to produce. A problem at one site can disrupt a supply chain spanning several countries. In that environment, “set and forget” power design no longer works. You need to know what is happening in real time and what is likely to happen next. That is where IoT and predictive analytics earn their place.
What the invisible grid actually looks like
The invisible grid is not a single product. It is the way several simple pieces work together. At the edge, you have devices that see what the human eye cannot. Smart meters track current, voltage, and power quality. Temperature sensors watch key components. Modern solar inverters and battery systems report their output, state of charge, and any internal alarms.
That data does not stay on the wall. Gateways collect it and send it to a central platform. Better systems are built for real-world conditions, so they can handle patchy connectivity and noisy signals without falling apart. On top of this, analytics engines look for patterns. They study what “normal” looks like on a Tuesday afternoon in March for your site, not a theoretical site in a textbook. They notice when motors draw more current than usual, when a transformer runs warmer than expected, or when voltage problems coincide with specific times of day. Finally, there is the response layer. This is where the insight turns into action. It might mean shifting some equipment to a different time window, changing how a battery charges and discharges, or sending a clear message to maintenance that says, in plain language, “This chiller is likely to fail soon if nothing changes.”
Taken together, that is the invisible grid: same electrons, different levels of awareness.
Moving from alarms to foresight
Many facilities already have alarms. A light turns red, a buzzer sounds, or a text message goes out when something crosses a limit. The problem is that alarms talk in the past tense.
By the time they trigger, the event has already happened. A breaker has tripped. A motor has overheated. A process has stopped. Predictive systems try to move that moment earlier.
Instead of saying “the transformer has overheated,” they say “this transformer is slowly moving outside its normal temperature pattern over the last two weeks.” Instead of waiting for a sudden spike in demand charges on the monthly bill, they warn that tomorrow’s production and weather mix is likely to push the site above its contracted demand. That extra time is where the value is.
It lets operators choose how to respond, rather than just cleaning up the mess.
In practical terms, this often means:
- Fewer sudden stoppages.
- Longer life for expensive equipment.
- More stable production during the hottest months or the busiest seasons.
Firms like Solaren, which manage large commercial and industrial solar and energy portfolios, now treat predictive monitoring as core to their solar panel installation Philippines projects because multi-site and industrial users cannot afford downtime.
Three everyday situations where the invisible grid earns its keep
To make this less abstract, picture three widespread operations in Southeast Asia.

A food processing plant with rooftop solar
The plant has large chillers, conveyor lines, and a sizeable solar array on the roof. Sensors watch chiller power and temperatures. Inverters send live data on solar output. The platform learns how they behave together at different times of day and year. It notices that on very bright days, with high production and high cooling demand, the main transformer runs closer to its thermal limits than the design team expected.
The system sends a simple instruction the day before a risky pattern:
“Between 1 pm and 3 pm tomorrow, stagger defrost cycles and avoid starting new heavy loads.”
Nothing dramatic happens, which is precisely the point.
A regional retail chain
A retailer runs dozens of branches across several cities. Some are in areas with strong grids. Others see occasional voltage dips at busy times or during storms. Smart meters and basic site sensors report in from every store. The analytics layer compares them and spots a pattern. Certain branches have recurring problems on weekday evenings when local demand peaks.
Instead of finding out through customer complaints and lost card transactions, the head office already knows which stores are vulnerable. They can slightly adjust cooling setpoints and nonessential loads for those locations on those days.
The customers feel that the store “always seems to be working.”
A logistics hub with cold rooms and electric vehicles
A logistics operator has cold storage and forklifts and is now running electric delivery vehicles. Charging, cooling, and material handling all draw power, often simultaneously. Without a predictive view, the hub would regularly exceed its demand limit and pay for it through utility penalties or surprise bills.
With an invisible grid in place, the operator can see when a specific combination of charging and cooling will put the site at risk. Charging windows shift slightly, and some lower-priority loads move to a different time slot. The warehouse stays cold, the vehicles are ready, and the bills are under control. Energy engineering teams like Solaren’s in the Philippines are now using this exact model for multi-facility clients who run cold storage, EV fleets, and distributed solar assets.
Designing for the region, not for a brochure
Many digital power solutions look good in marketing material and on clean dashboards. The real test is whether they work in a hot, humid, busy facility with people under pressure and networks that drop in and out. Sites in Southeast Asia provide that test every day.
Conditions are varied. Some facilities sit on powerful urban grids. Others are in developing industrial zones or remote areas with weaker supply. Some have excellent connectivity and internal IT support. Others rely on basic links and a tiny technical team.
For this reason, success in the region usually comes from a few simple design choices:
- Start with the most critical loads, not with every socket in the building.
- Pick one or two clear use cases where failure is expensive or painful.
- Make the outputs easy to understand for the people who already know the plant well.
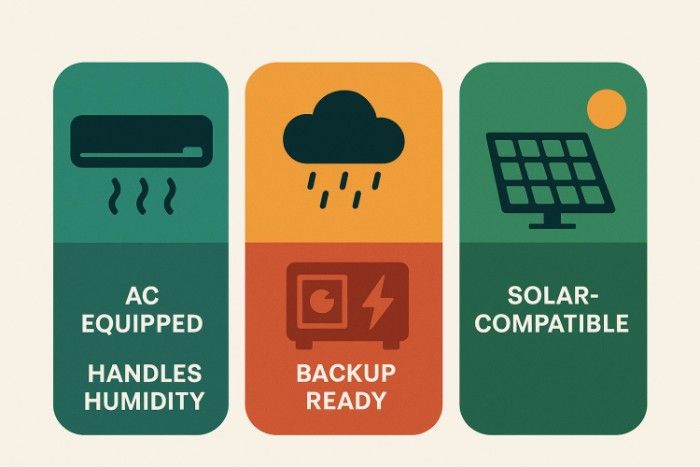
Once that is in place and delivering results, it becomes much easier to justify extending the same logic across a wider portfolio. Companies like Solaren, which operate entirely in Southeast Asian conditions, design their systems around these realities. Heat, humidity, unstable feeders, and variable demand are not edge cases; they are the everyday environment.
The human layer that makes it work
It is tempting to view predictive analytics as if it replaced human judgment. That is not how it works in practice. Many plant managers and site engineers in the region have been with their facilities for years. They can hear when a motor sounds wrong. They can feel when “the power is not quite right today.” Their experience is an asset, not a weakness. The invisible grid works best when it captures and strengthens that experience.
If you involve those people when you define what a useful alert looks like, they will trust it. If the system explains its warnings in plain language, they will act on them. If you feed field results back into the models, the models will better reflect how the plant actually behaves. In other words, the invisible grid is not only a technology project. It is also a way to share and scale the knowledge that already exists in the team.
Where is this heading for C and I users
Over the next few years, several trends seem likely for commercial and industrial users in Southeast Asia. The first is consolidation. Today, many sites have separate tools for solar monitoring, building management, fault logging, and maintenance. Over time, these views will merge into a single picture of “how healthy is my site right now.”
The second is learning. Early systems rely heavily on fixed rules and thresholds. As more data accumulates, models will adapt to each facility’s behavior, local climate, and local grid, without constant manual tuning.
The third is a change in how backup assets are used. Batteries, generators, and controllable loads will move from being rare, emergency-only tools to everyday levers adjusted in small ways, many times a month, based on predictions.
The question for leaders is shifting from “What is our tariff per kilowatt hour?” to something broader.
A more helpful question might be:
“How clearly can we see our own invisible grid, and what are we doing with that information?”
The businesses that answer that with real data and clear action plans are likely to be the ones whose operations feel calm even when the visible grid around them is under stress. And in markets like the Philippines, where C and I facilities often run on mixed-grid quality, companies such as Solaren are already using this approach to stabilize industrial operations, protect uptime, and keep mission-critical loads online when physical infrastructure alone cannot.


