")
Data cleansing without measurement is just guesswork. When an organization doesn’t have specific data quality metrics for evaluating quality, it can’t assess if quality has improved, but only that quality is now in some other area of concern. Stats indicate that bad data causes businesses in the US to lose $3 trillion per year. Nearly 60% of businesses are not aware of how bad data can actually costs them as they don’t measure the business impact.
Using data quality metrics to measure performance before and after data cleansing creates a framework for the cleansing process. A baseline is created; improvements in quality can be measured; and value can be proven by tracking the return on investment of data quality. Perhaps most importantly, pre- and post-cleansing metrics enable the move away from a onetime data cleanse project and toward a continuous improvement program where data health is tracked, managed, and maintained as the company evolves.
Key Takeaways
- Data cleansing without specific data quality metrics leads to guesswork and inefficiencies in assessing data quality improvements.
- Measuring performance before and after data cleansing establishes a framework to document improvements and ROI.
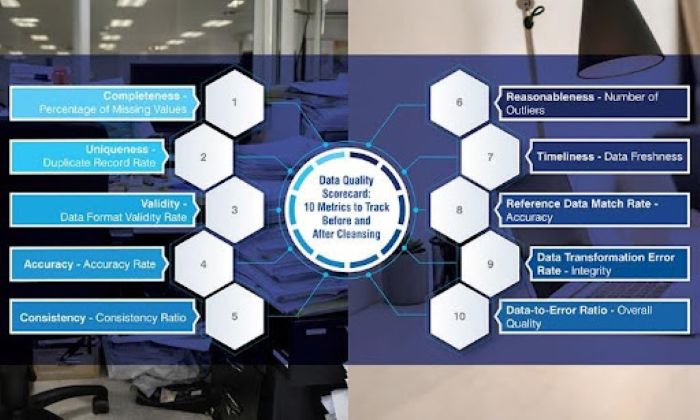
- Key data quality metrics include completeness, uniqueness, validity, accuracy, consistency, reasonableness, timeliness, reference match rate, transformation error rate, and data-to-error ratio.
- Tracking data quality metrics creates a culture of ongoing data management linked to business objectives.
- Continuous measurement and management of data quality metrics enhance decision-making, reduce risk, and maintain a competitive advantage.
Table of contents
- 10 Essential Data Quality Metrics To Measure Before and After Data Cleansing
- Completeness – Percentage of Missing Values
- Uniqueness – Duplicate Record Rate
- Validity – Data Format Validity Rate
- Accuracy Rate
- Consistency Ratio
- Reasonableness – Number of Outliers
- Timeliness – Data Freshness
- Reference Data Match Rate (Accuracy)
- Data Transformation Error Rate (Integrity)
- Data-to-Error Ratio (Overall Quality)
- Benefits Of Tracking Metrics Before & After Data Cleansing
- Conclusion
10 Essential Data Quality Metrics To Measure Before and After Data Cleansing
The following are 10 key data quality metrics you can track and measure for improvement before and after cleansing:
Completeness – Percentage of Missing Values
This metric assesses the number of empty fields in key fields such as Customer ID, Email Address, etc. High missing rates can greatly diminish the usability of data regardless of the volume of data.
Before Data Cleansing
Missing values are most likely indicative of problems related to how data was captured, integrated, or migrated upstream in the process.
The result of these missing values will be unsuccessful contact attempts, poor segmentation, and unreliable reports.
After Data Cleansing
The percent of missing values should show an improvement as a result of data being cleaned and formatted correctly.
Typical methods of improving completeness include:
- Reliable data enrichment from known and trusted sources
- Improved validation rules
- Restoration of fields that were previously found to be incomplete
- Elimination of unusable records
Uniqueness – Duplicate Record Rate
Duplicate record rate assesses the number of records representing the same entity (e.g., a customer) greater than once. Typically identified by matching keys (e.g., email address, phone number), duplicate records increase customer count and skew analytics.
Prior to cleansing, duplicate records arise from siloed systems, duplicate imports, and inconsistent identifiers.
After Data Cleaning
The goal of effective deduplication is to take that duplicate record rate down to zero, and effectively do so through entity matching, merging of records, and standardizing the identifiers used.
Validity – Data Format Validity Rate
Valid data format refers to the percentage of valid values within a specific format (e.g., standardized dates, correctly formatted phone numbers).
Low data format validity prior to cleansing is common due to multiple systems feeding data without consistent rules. Examples include the use of different date structures, abbreviation styles, or codes, which hinder processing.
Post-Data Cleansing
The application of format validation standards and the normalization of field formats increases the format validity rate.
Some key activities to improve validity and completeness in data quality include:
- Creating rules for validating format requirements
- Establishing standardized abbreviations and coding
- Standardizing the format for entering dates and numbers
Accuracy Rate
Accuracy rate refers to the amount of data that accurately represents the entity or attribute in question, typically validated against trusted sources.
Common reasons for lower accuracy:
- Outdated customer information
- Errors caused by humans when manually entering data
- Incorrect third-party entered data
- No routine verification process
- Ways to improve accuracy
- Validating data cross-checked against trusted sources
Inaccurate data prior to cleansing arises from out-of-date records, manually entered errors, or unreliable third-party data.
After validating and correcting the data, the accuracy rate should improve. Improved accuracy allows for better targeting, reporting, and customer data quality benchmarks to ensure that decisions are made based on factual data rather than inaccurate data.
Consistency Ratio
Consistency ratio compares the similarity in data representation across systems. For example, a customer’s address should appear consistently in both their CRM and Billing Systems.
Low consistency ratios prior to cleansing typically result from disconnected updates to siloed systems and variations in names or attributes used to identify data.
Data cleansing can increase consistency by normalizing and synchronizing data.
Actions that contribute to increasing consistency consist of:
- Using standardized naming conventions
- Combining alternate spellings
- Synchronizing master records across systems
- Creating Master Data Management Rules
Reasonableness – Number of Outliers
Outliers refer to values that fall outside of normal limits (i.e., Negative Price, Unrealistic Age). This metric determines if data makes sense in a real world context.
Prior to cleansing, outliers typically arise from either manual error, system error, or lack of constraint checking.
After Data Cleansing
Based upon validation rules and business thresholds, outliers will be corrected, validated, or eliminated from the dataset.
Timeliness – Data Freshness
Data freshness or data timeliness metrics refers to the time lag between creation/update of data and the current moment.
Prior to cleansing, long delays in updating data generally occur due to slow integration cycles, or infrequent data refreshes resulting in stale data.
Post-Cleansed Data
Faster and improved cleansing of data through better cleansing pipelines and updating systems reduces the time gap.
Reference Data Match Rate (Accuracy)
Match Rates for Reference Data (Accuracy) is the percentage of records that match up to a reference source, such as verifying addresses using a post office database or checking the name of a company in an official business registry.
Before Cleaning Your Data
The lower the match rate, the greater the number of inaccuracies within your database; which could be caused by multiple factors. The information being out of date, misspelled names, missing field entries, inconsistencies in formatting etc.
Typically, after cleaning your data, some typical improvements made to a database match rate would include:
- Verification of Address/Identity
- Ensuring Format Consistency prior to Matching
- Adding Reference Field Information Where Missing
- Eliminating Unverifiable Records
Data Transformation Error Rate (Integrity)
Transformation error rate (Data Integrity) shows how many times there are errors in converting the format, structure or system of your data as you process it.
Transformation Errors Prior to Data Cleansing
When the transformation error rate is higher, the most common reasons for this are due to format compatibility issues, incorrect field mappings, logic rule issues and/or poor definition of transformation script.
Transformation Error Rates After Data Cleansing
- Lower transformation error rates will indicate that your ETL process is more reliable and can be trusted.
Typically, improvements to reduce transformation error rates are made by:
- Ensuring better field mappings and schema alignment
- Using stronger validation rules
- Testing the transformation logic
Data-to-Error Ratio (Overall Quality)
The Overall Quality, or Data-to-Error Ratio, calculates the portion of identifiable data errors to the total amount of data records. The errors can be in the form of missing information, inaccurate information, duplicate information, or improper formats.
Pre-Cleaning Data
A higher ratio of errors to clean data means there is a wide spread of quality issues within the data due to lack of validation, inconsistency in data entry, or system integration issues.
Post-Cleaning Data
Typical improvements that affect the error-to-clean ratio include:
- Rules applied to validate and standardize the data
- Processes that eliminate duplicate records
- Enrichment and corrections made to the data
Benefits Of Tracking Metrics Before & After Data Cleansing
Establishing data quality metrics prior to and after data cleansing establishes credibility to a tangible measure for the improvements made rather than assumptions. Rather than viewing data quality as a one-time clean up activity, the use of data cleansing as a performance discipline will help to establish a culture that views data quality as an ongoing discipline that is linked to business objectives.
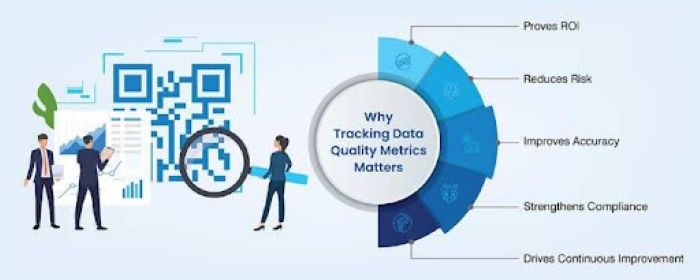
Some of the key advantages to using tracking metrics are:
- Establishes justification for data quality initiatives by demonstrating quantifiable improvements and ROI
- Data integrity tracking decreases operational risks due to errors, system failures, or poor decision-making based upon inaccurate data
- Ensures that analytical results are accurate by establishing a reliance on credible input in the form of reports and models
- Enhances compliance and reporting capabilities via improved traceability and validation of records
- Enables the identification of trends and repeated data quality issues, enabling the development of programs designed to continuously improve data quality
Conclusion
Data cleansing is a continuous process and an ongoing discipline that provides for reliable data over time; as systems grow and additional data streams are added, quality declines without continuous oversight and management.
Using data quality metrics transforms data cleansing from a reactive process to a strategic and quantifiable process. Metrics to measure data quality and consistently tracking data accuracy over time result in organizations making better decisions; operating more effectively and reducing risk. What gets measured gets improved and in the case of data, improving it will create and sustain a competitive advantage.


