
The Posted-Rate Mirage
Refresh any U.S. load board, and a crisp-looking rate flashes back—last week, Los Angeles → Dallas averaged $2.27 per mile. Seasoned dispatchers eye that figure on freight optimization the way bond traders eye teaser APRs: the headline hides three invisible levies.
- Roads. Rutted pavement shakes freight, shortens component life, and forces detours that add time and fuel.
- Carbon. Every detour and five-minute idle piles on new tons of CO₂ that regulators will soon monetize.
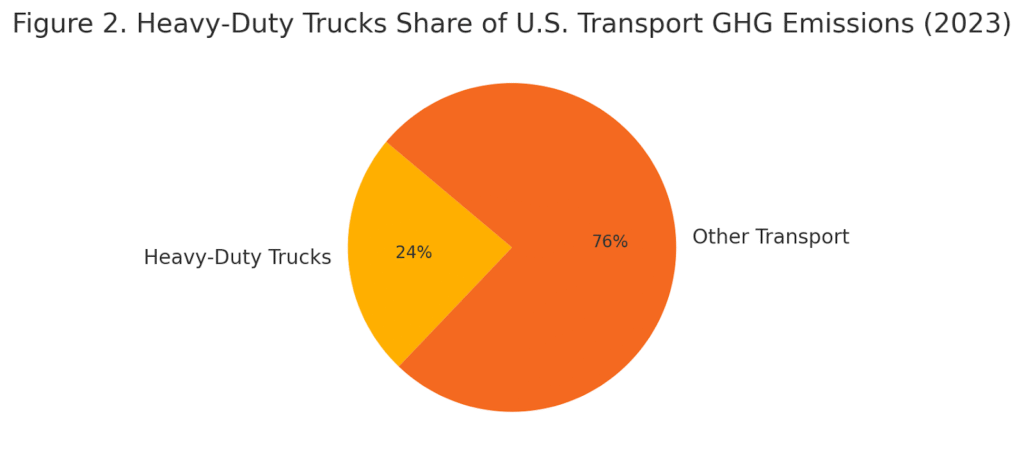
- Air runs. Sixteen percent of tractor mileage in 2024 rolled empty, diesel burned to haul nothing at all.
Stacked together, these costs behave like an unofficial national excise tax nobody voted for, yet every household ultimately pays.
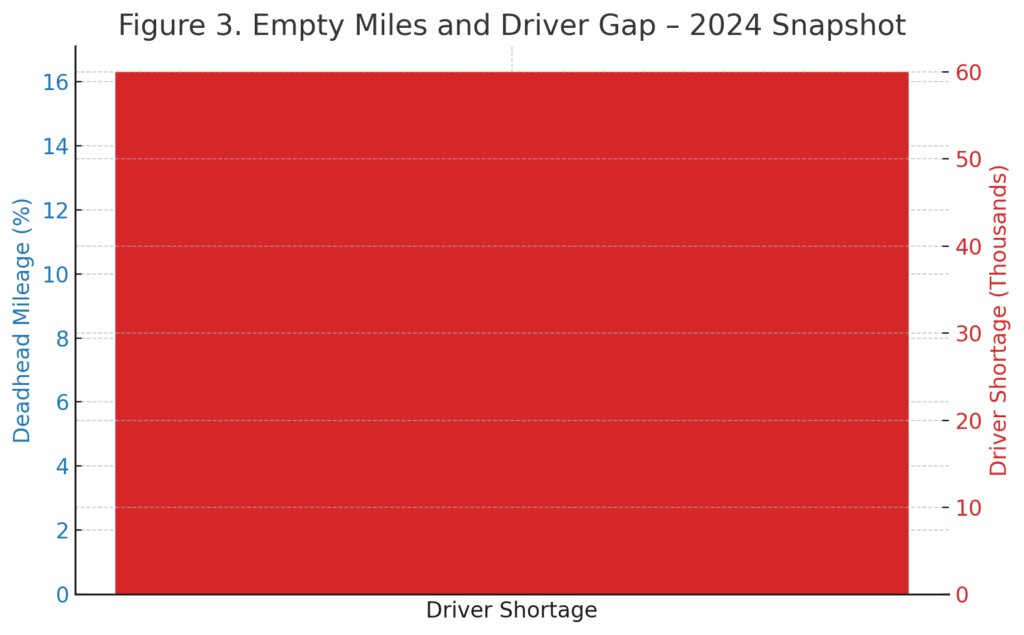
Heavy-duty trucks represent a small slice of America’s vehicle count but now generate roughly one-quarter of transportation-sector greenhouse-gas output; looming disclosure rules will convert that slice from an abstract climate metric into a direct operating expense.
The labor market worsens the spiral. Roughly 60,000 driver seats sat empty at the close of 2025 (the gap peaked at 81,000 in 2021). Many recruits quit on discovering that nearly one in six earns zero revenue while compliance paperwork multiplies.
Key Takeaways
- The article discusses the ‘Posted-Rate Mirage’ where average rates obscure hidden costs in freight optimization, including road damage and CO₂ emissions.
- It introduces TruckSync, a platform that integrates real-time data streams to optimize freight operations and reduce expenses.
- Pilot studies have shown that TruckSync can reduce empty miles and save fuel, with significant operational and environmental benefits.
- The article advocates for federal initiatives like a Unified Weight API and Dynamic Tolling to enhance freight optimization on a national scale.
- In conclusion, when integrated data improves transparency in costs, it aligns freight optimization with genuine resource use, benefiting shippers and taxpayers alike.
Table of Contents
- The Posted-Rate Mirage
- One Feedback Loop – Not Three Crises
- The Trucksync Hypothesis: Data as Lubricant
- Three Years, Five Fleets, One Living Laboratory
- Peer Benchmarks for Freight Optimization
- Why An Integrated Ledger Outperforms
- Four Federal Levers for National Scale
- Culture & Inclusion
- Limitations & Future Work
- Business Case at a Glance
- Key Takeaways for Policy & C-Suite
- Conclusion: Making the Mile Price Real
One Feedback Loop – Not Three Crises
By: Valerii Khomynskyi, Founder & CEO, TruckSync
A cracked slab rattles a loaded trailer and forces a 30-mile detour; the detour burns extra diesel; thinner margins defer the purchase of cleaner equipment; older tractors pound the same brittle asphalt again, cracking it further. One mechanical-economic loop spins downward.
Break the loop anywhere, and every stress point slackens.
Break it everywhere and drag flips into the flywheel. That premise became the blueprint for TruckSync.

The Trucksync Hypothesis: Data as Lubricant
In 2021, our team asked: If axle weight, real-time road-surface data, and live dock schedules flowed into one neutral cloud—and an AI engine optimized the mix every minute could we erase fines, idling, and empty detours fast enough to matter?
Three authenticated data streams share the same clock:
- Weight-in-Motion (WIM) packets are encrypted the instant an axle clears a scale.
- Telematics (location, fuel rate, idle minutes, surface temperature, roughness) stream every 60 s.
- Marketplace intelligence (pickup/delivery windows, dock-queue times) arrives live from broker APIs.
Merged, each mile becomes a three-currency vector: dollars, kilograms CO₂, and megapascal bridge fatigue. A lightweight edge-AI stack fuses the vectors, scores every segment, and reroutes before trouble reaches a dispatcher.
- Data-fusion: Gradient Boosting & LightGBM combine WIM, telematics, and queue latency.
- Graph Neural Network: 4.2 million U.S. road segments modelled to trade fuel for deck stress.
- Reinforcement policy: updates every 60 s within HOS and weight limits.
- Edge inference: TinyML on each ELD dongle keeps decisions alive during cellular outages.
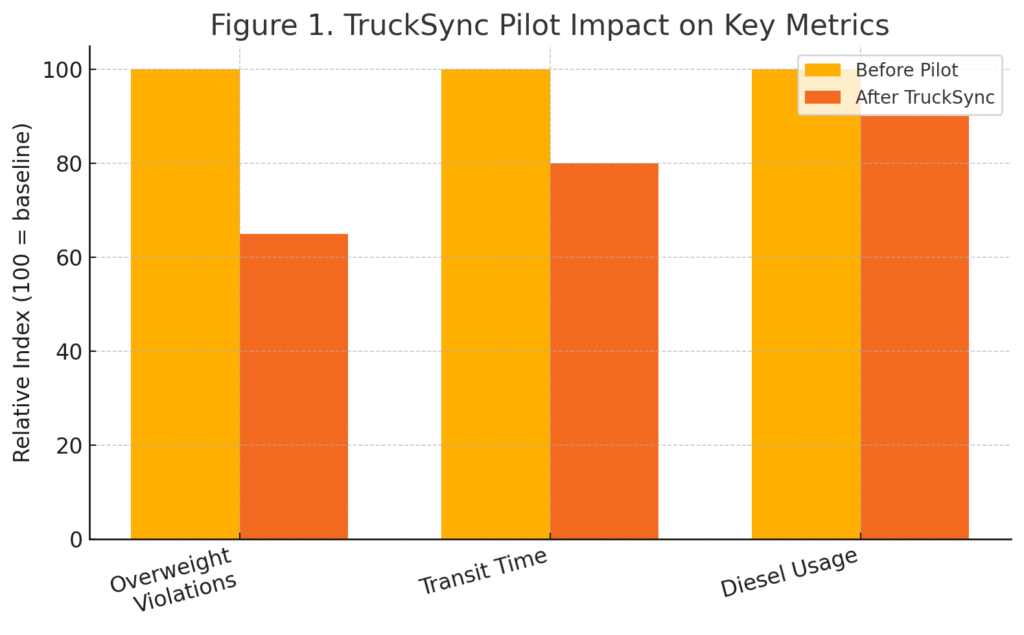
Three Years, Five Fleets, One Living Laboratory
Five mixed fleets in CA & TX instrumented 310 tractors and froze baseline KPIs. Quarterly audits show:
- Overweight citations – 35 %.
- Corridor transit time – 20 %.
- Diesel – 10 % (≈ 1.2 t CO₂ per tractor/year).
- Dispatcher check-calls – 46 %.
- Rookie weight-rule training – 50 %.
- On-time delivery 94 % even through I-10 & I-95 closures.
Scaled to a 10,000-tractor fleet:
- 42-million-gal diesel saved (≈ $450 M)
- 120 000 t CO₂e avoided
- $9 M fines averted
- 1.9 M driver hours freed, equivalent to 1,300 additional drivers without new hires.
- A 100-truck fleet trims operating cost 2-4 ¢/mi in 90 days and recoups hardware + SaaS in 11 months.
Peer Benchmarks for Freight Optimization
- MIT-CTL smart-routing (distance + congestion) → 6 % fuel-savings sim; TruckSync doubles that by adding weight & temperature.
- Univ. Arkansas bypass study cut idle, deadhead unchanged; TruckSync first cuts empty miles.
- ERoad 2023: 15.8 % empty miles on 100,000 trucks; TruckSync fleets 9.9 % after 3 months.
Empty Miles and Driver Gap, 2024 Snapshot
(Deadhead mileage = 16.3 %; long-haul driver shortage ≈ 60 000)
Why An Integrated Ledger Outperforms
Phoenix → Houston in August: asphalt 140 °F, half strength. A conventional TMS picks straight I-10; weigh stations ticket overloads after the fact; carbon tools track gallons. TruckSync’s edge-model weighs money, CO₂, and heat-weakened pavement strain and may pick a desert detour 10 mi longer, 15 °F cooler, bypassing the Fort Stockton queue—saving fuel, bridge fatigue, and HOS minutes in one move.
Multiply across millions of trips, and the ledger finances its own upgrades.
Four Federal Levers for National Scale
- Unified Weight API: Federate 50-state WIM feeds; toll bridges by real axle load + temperature; overload stops paying.
- Open Dock Calendars: Publish hourly weight windows; cut empty miles from 16 % to ~10 %; unlock ≈ $12 B and 250 M driver miles annually.
- Software Tax Credit: $2 000 per tractor for real-time compliance dashboards costs less than new schools and retains Gen-Z drivers.
- Dynamic Tolling: Europe charges more for heat-softened asphalt; U.S. adoption would delay resurfacing and redirect savings to preventive repair.
Heavy-Duty Trucks’ Share of U.S. Transport GHG Emissions (2023)
(Heavy-duty trucks = 24 %; all other transport modes = 76 %)
Culture & Inclusion
- Make it easy. ≤ 9 taps per driver task.
- Aim higher. Bridge-fatigue GNN in beta.
- Be welcoming. Councils span owner-operators, mega-fleets, and DOTs.
- Embrace curiosity. Quarterly hackathons birthed predictive maintenance.
- Together we can. Live dashboards with district DOTs outpace MOUs.
Nationwide Roadmap for Freight Optimization
| Phase | Years | Milestones |
|---|---|---|
| Phase 1 | 2025 – 2026 | • Connect 570 remaining public WIM stations • Onboard 15 000 tractors across 48 contiguous states + Alaska intrastate loads |
| Phase 2 | 2027 – 2028 | • Train the GNN on 10 billion axle-temperature-load pairs • Launch pothole-prediction overlay (6-week horizon) • Integrate Puerto Rico & Hawaii sea-dock data |
| Phase 3 | 2029 | • Publish anonymized infrastructure-stress indices on the federal GeoPlatform so every state can target resurfacing dollars by preventable ton-mile damage avoided |
Limitations & Future Work
- Climate bias: Snow-belt validation starts Q4 2025 (chain-law data).
- Sensor density: Rural WIM sparse; telemetry-only axial-force estimator in lab tests.
- Marketplace friction: Not all brokers publish queue APIs; open JSON schema under review at TIA.
- Regulatory lag: Dynamic tolling needs interstate compacts; KY–OH–IN pilot slated 2026.
Business Case at a Glance
| Metric | Value (100-truck fleet) | Timeline |
|---|---|---|
| Expense drop | 2-4 ¢/mi | 90 days |
| Capital payback | 11 months | — |
| Carbon reduction | 120 000 t CO₂ per 10 000-tractor fleet | annual |
Key Takeaways for Policy & C-Suite
- AI fusion of WIM, telematics, and dock data can push empty miles < 10 % within one quarter
- Every 1 % deadhead cut removes ~7 M truck-miles of diesel.
- Dynamic tolling aligns compliance with cost, with no new taxes.
- Unified data standards beat new lane-miles on ROI and pavement longevity.
- Fifty-state rollout meets freight growth without adding asphalt or drivers.
Conclusion: Making the Mile Price Real
When axle weight, pavement modulus, and dock windows share one authenticated ledger, the freight rate stops acting like a roulette chip. It becomes a transparent invoice for genuine resource use, financial, environmental, and infrastructural. Shippers gain predictability, carriers reclaim margin to modernize, drivers keep usable hours, and taxpayers inherit highways that last longer for less money.
The technology is proven, the economics clear, and the policy levers straightforward. Treat data as the lubricant for freight optimization that prevents a $4-trillion supply chain from grinding itself into dust, and the next posted rate will finally mirror the cost we all pay—and this time, the math will add up.


